A web server and R package for plotting RNA secondary structures, trans RNA-RNA, RNA-DNA and DNA-DNA interactions and genomic interactions.
R-chie allows you to make arc diagrams of RNA secondary
structures, allowing for easy comparison and overlap of two
structures, rank and display basepairs in colour and to also
visualize corresponding multiple sequence alignments and
co-variation information.
R4RNA is the R package powering R-chie, available for download and local use for more customized figures and scripting.
Available types of plots (click to load example input to web form)
Single Entity [RNA or DNA]
Multiple Entities [RNA-RNA RNA-DNA DNA-DNA]
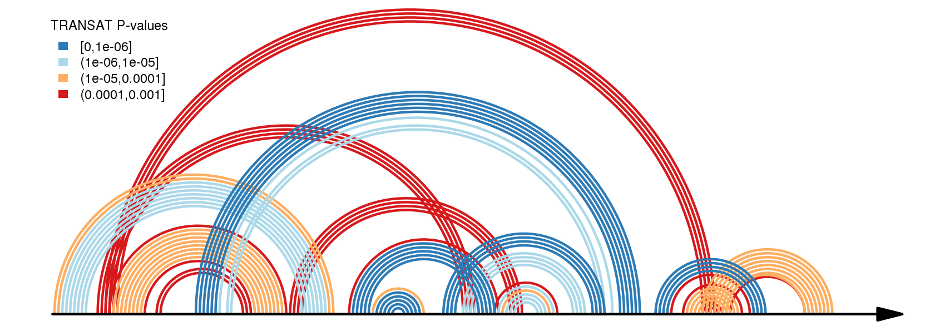
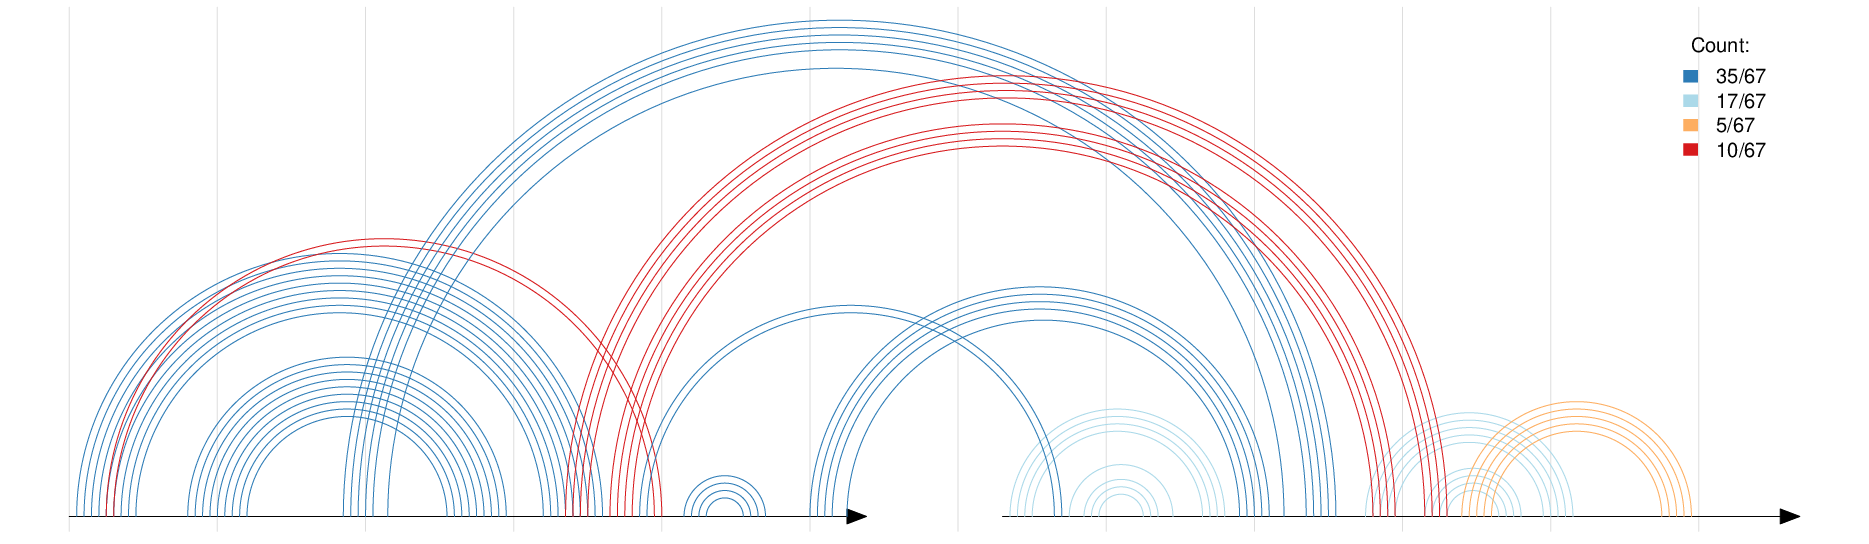
Visualize complicated basepairing as arcs on a linear sequence, colouring basepairs by value.
e.g. TRANSAT basepairs predictions for the Cripavirus internal ribosomal entry site (IRES), RF00458, coloured by p-value.
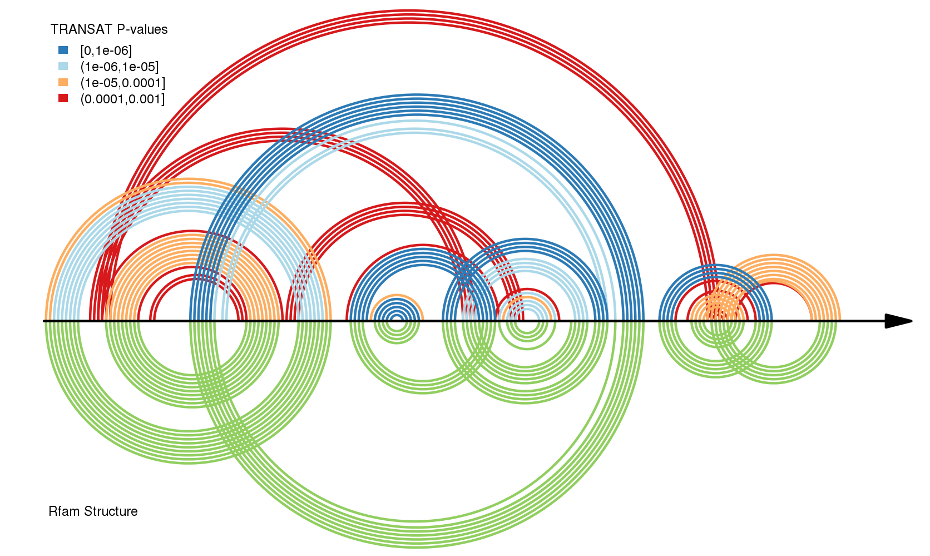
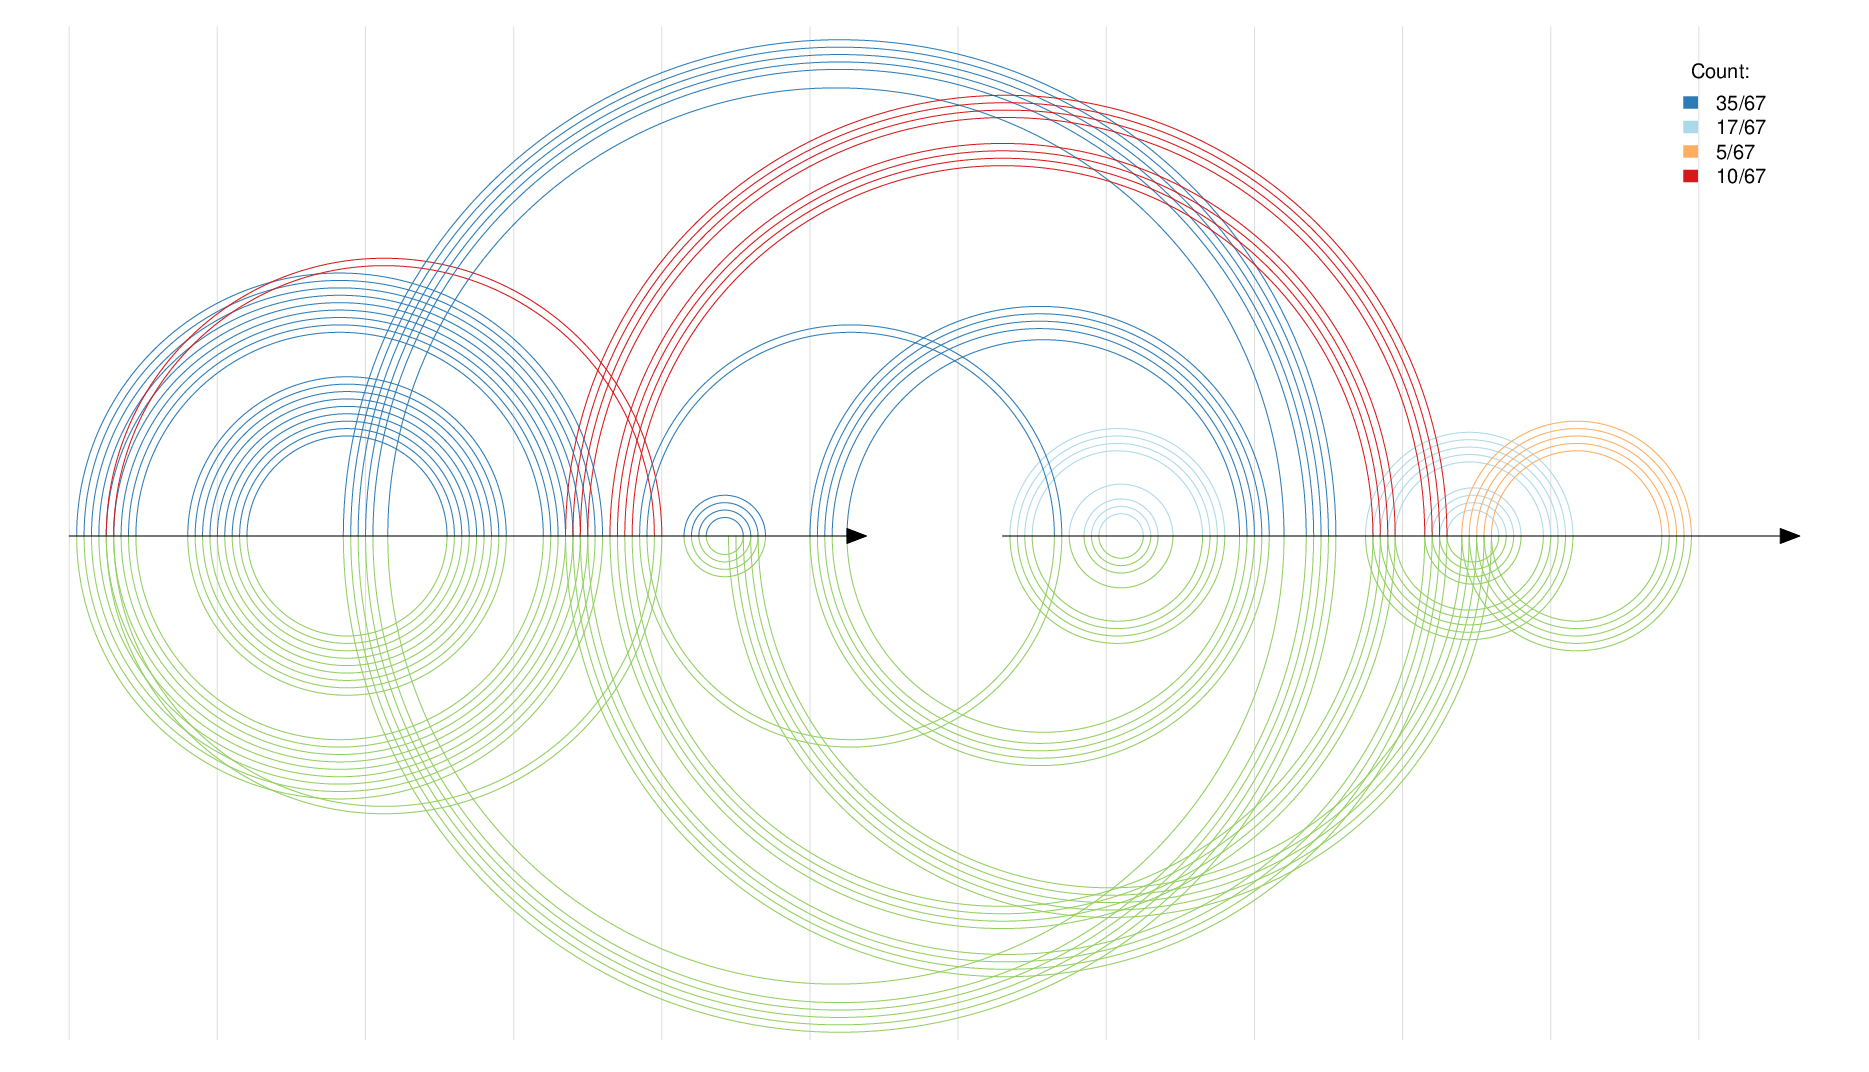
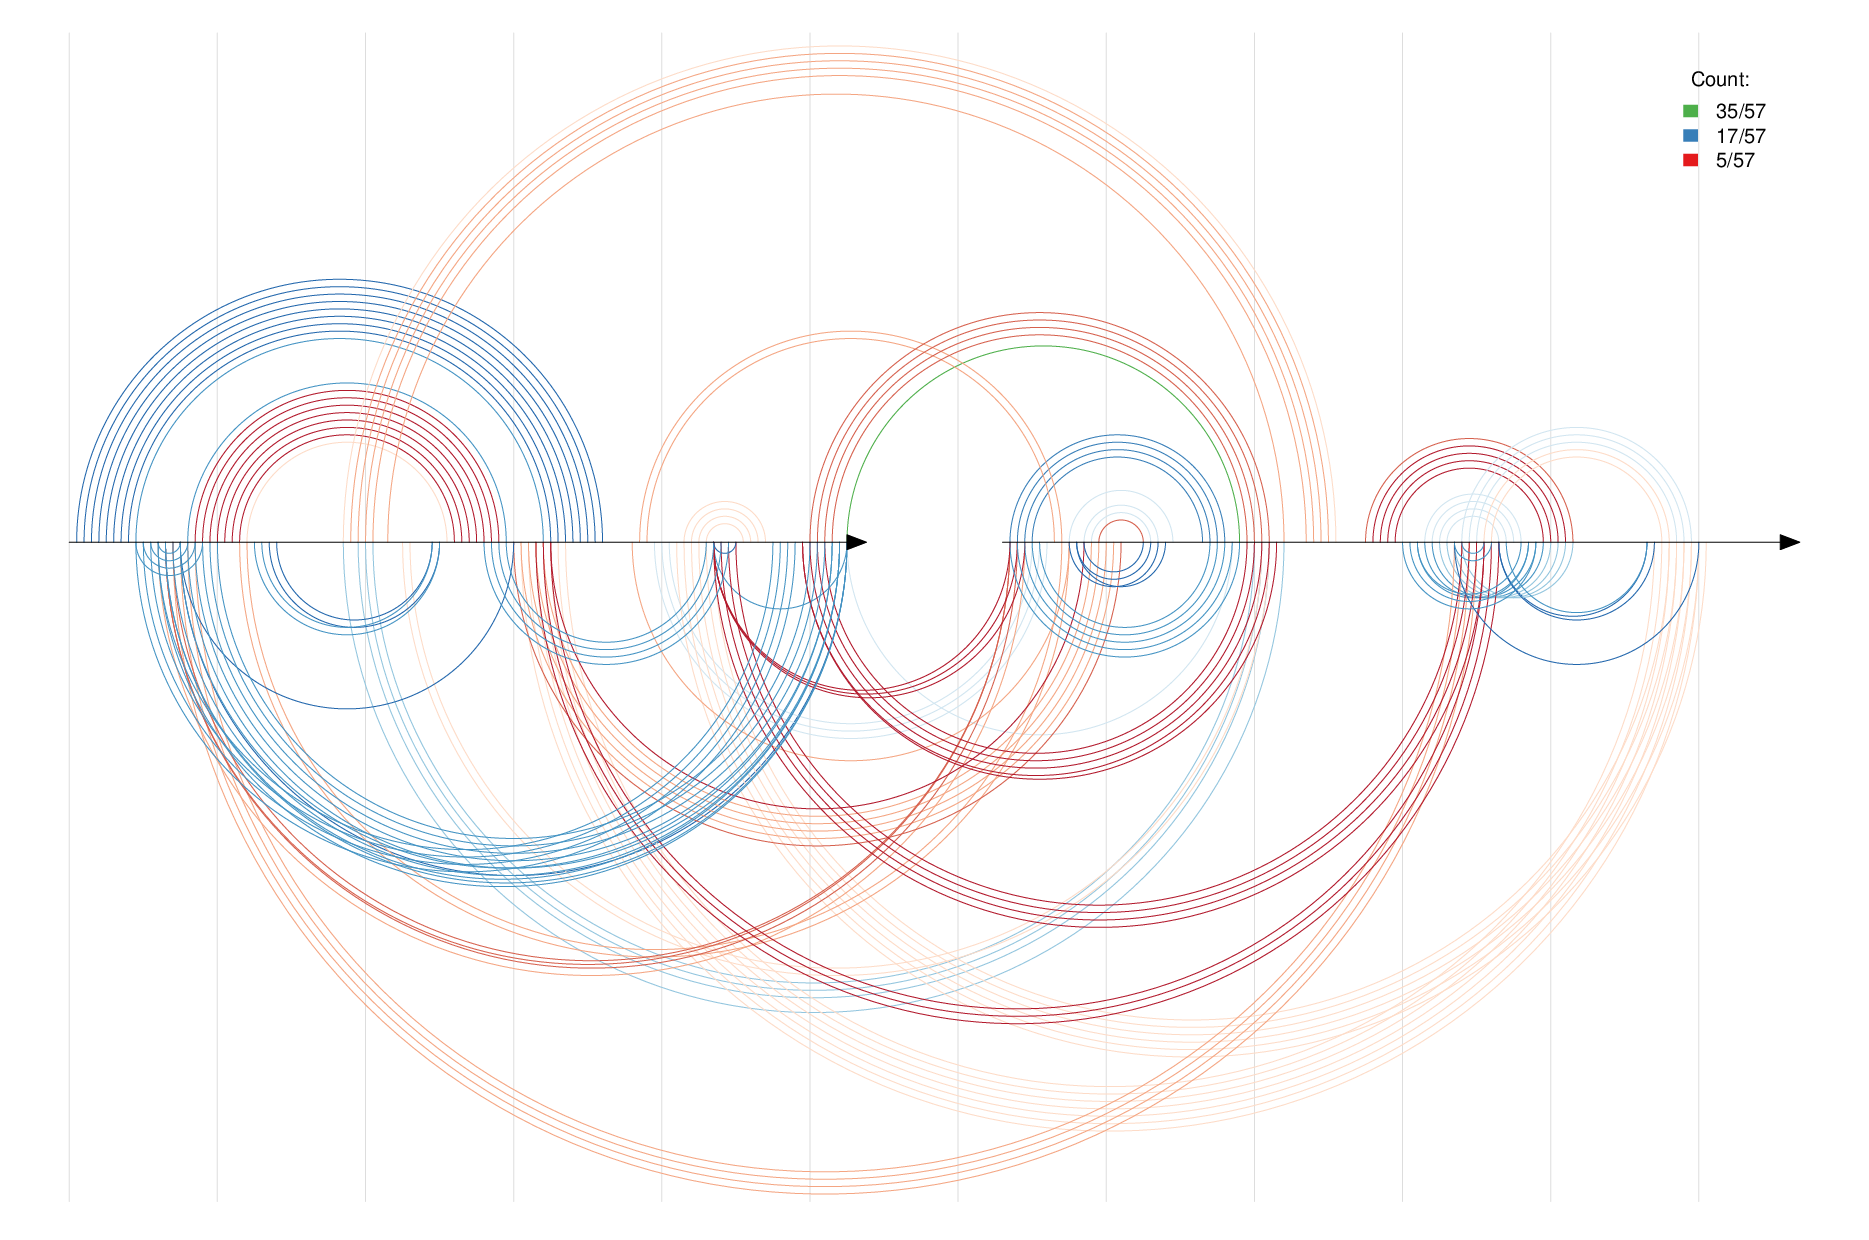
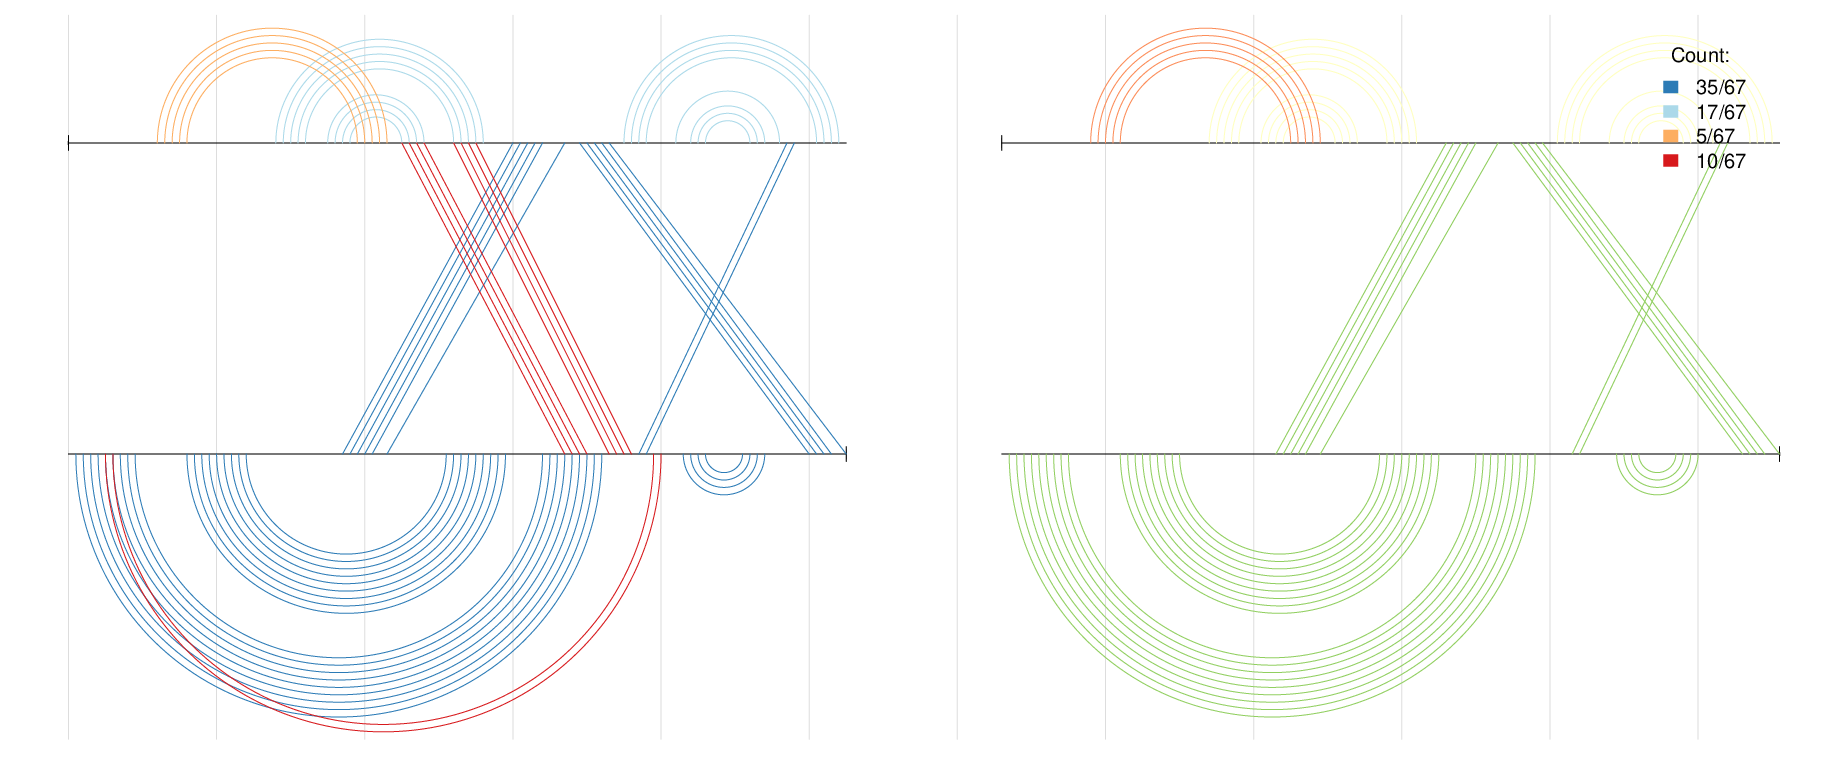
Plot two structures on the same sequence for easy comparison.
Top: Helices predicted by TRANSAT for the Cripavirus IRES, RF00458, coloured by p-value.
Bottom: Helices known from experimentally determined structure.
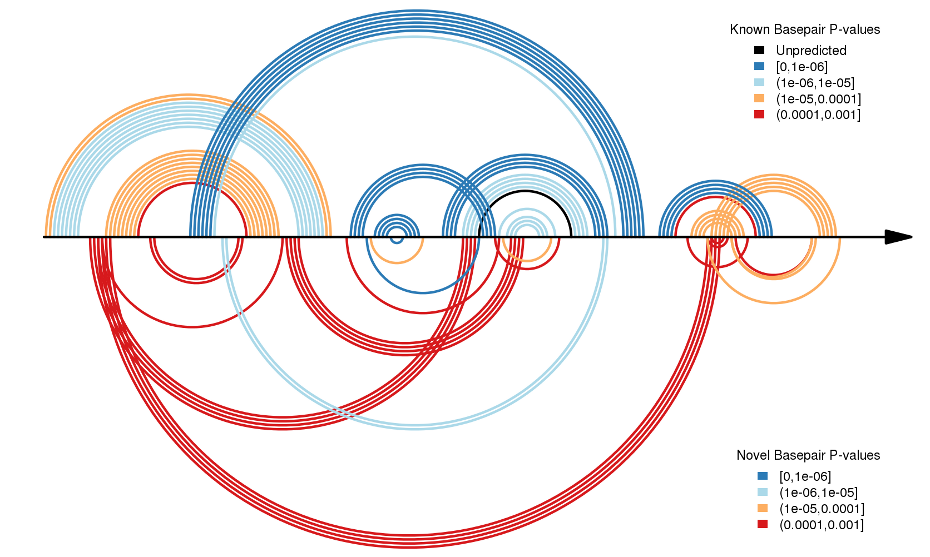
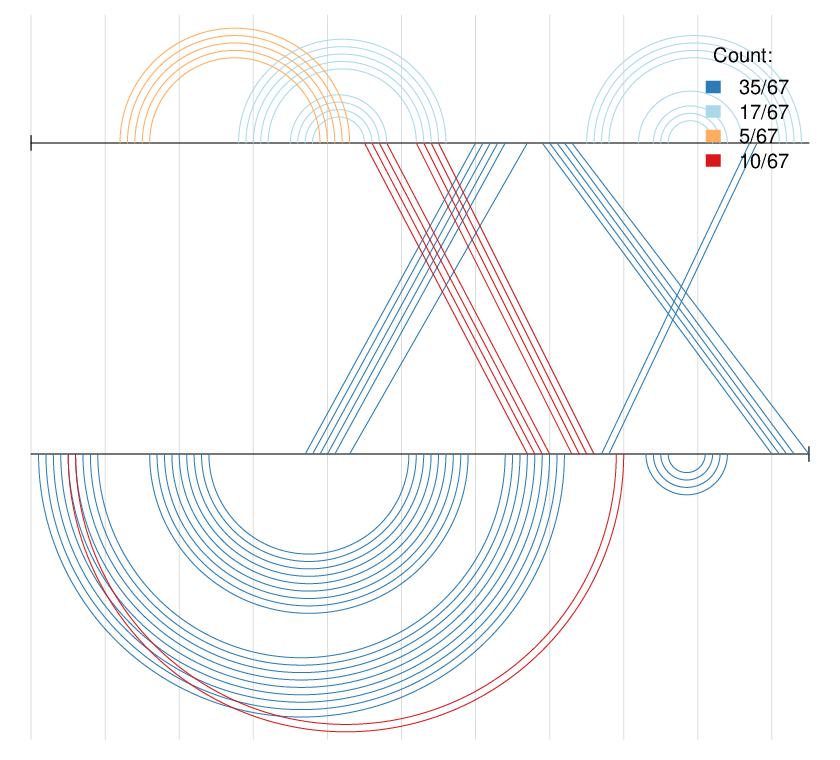
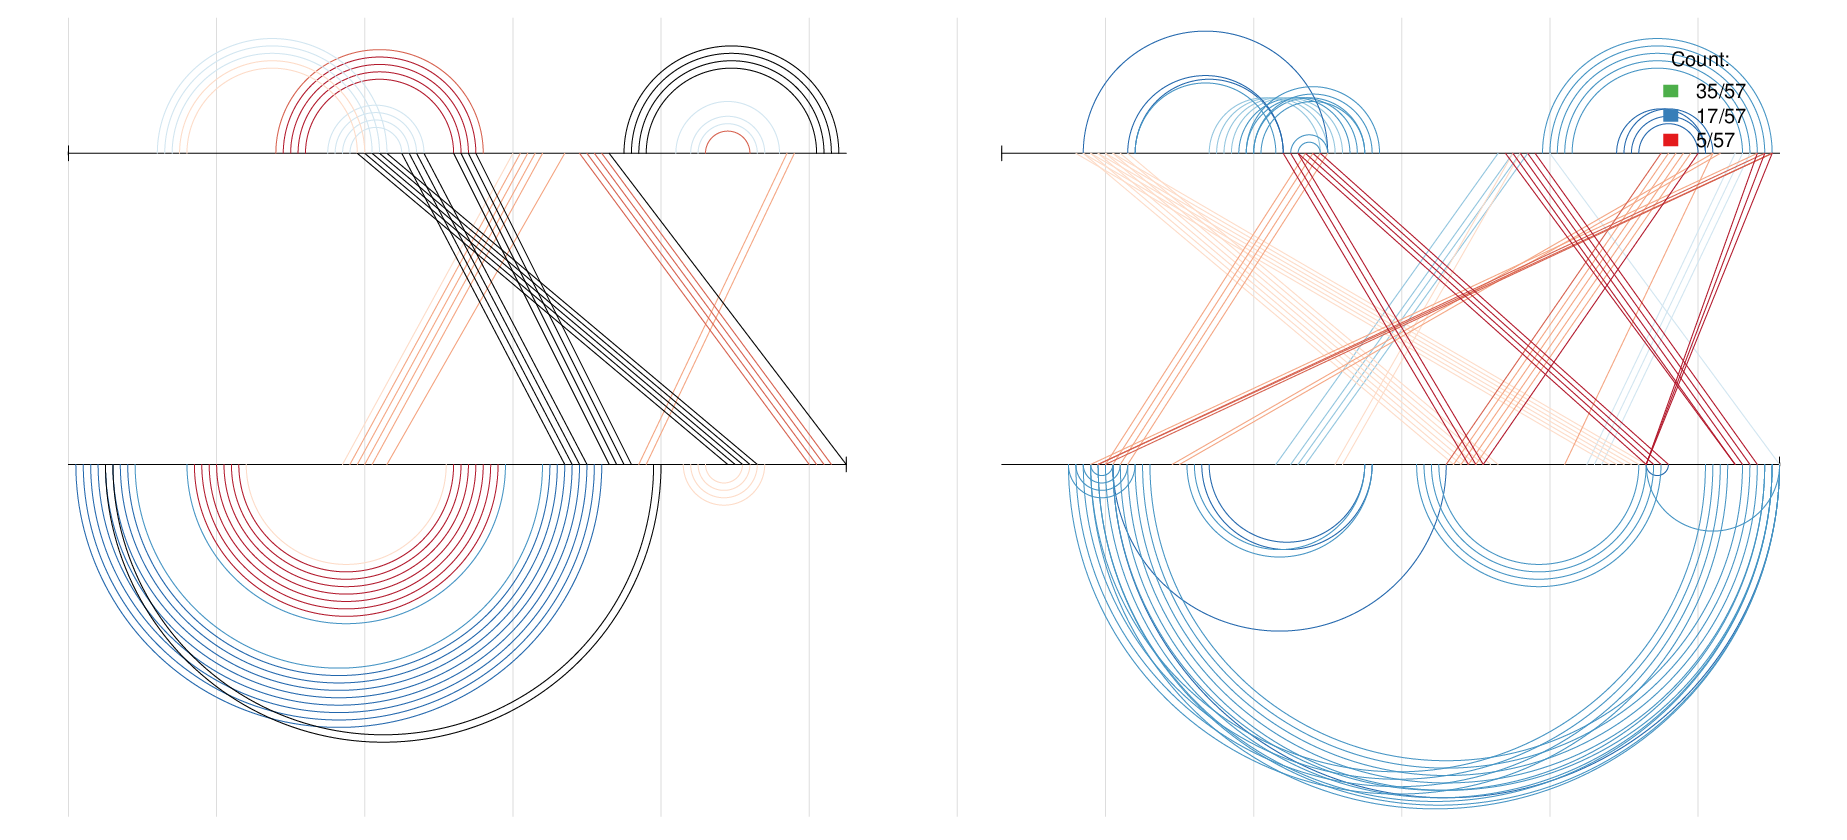
Overlap two structures to highlight similarities and differences on the same sequence.
Top: The known reference structure of RF00458, coloured by p-values when predicted by TRANSAT.
Bottom: TRANSAT predicted helices not found in the known structure, coloured by p-value.
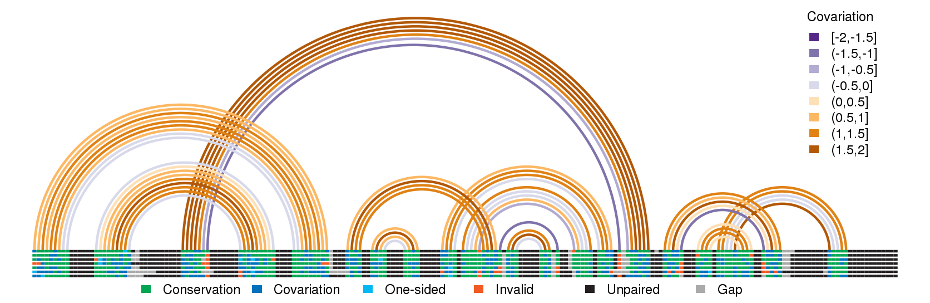
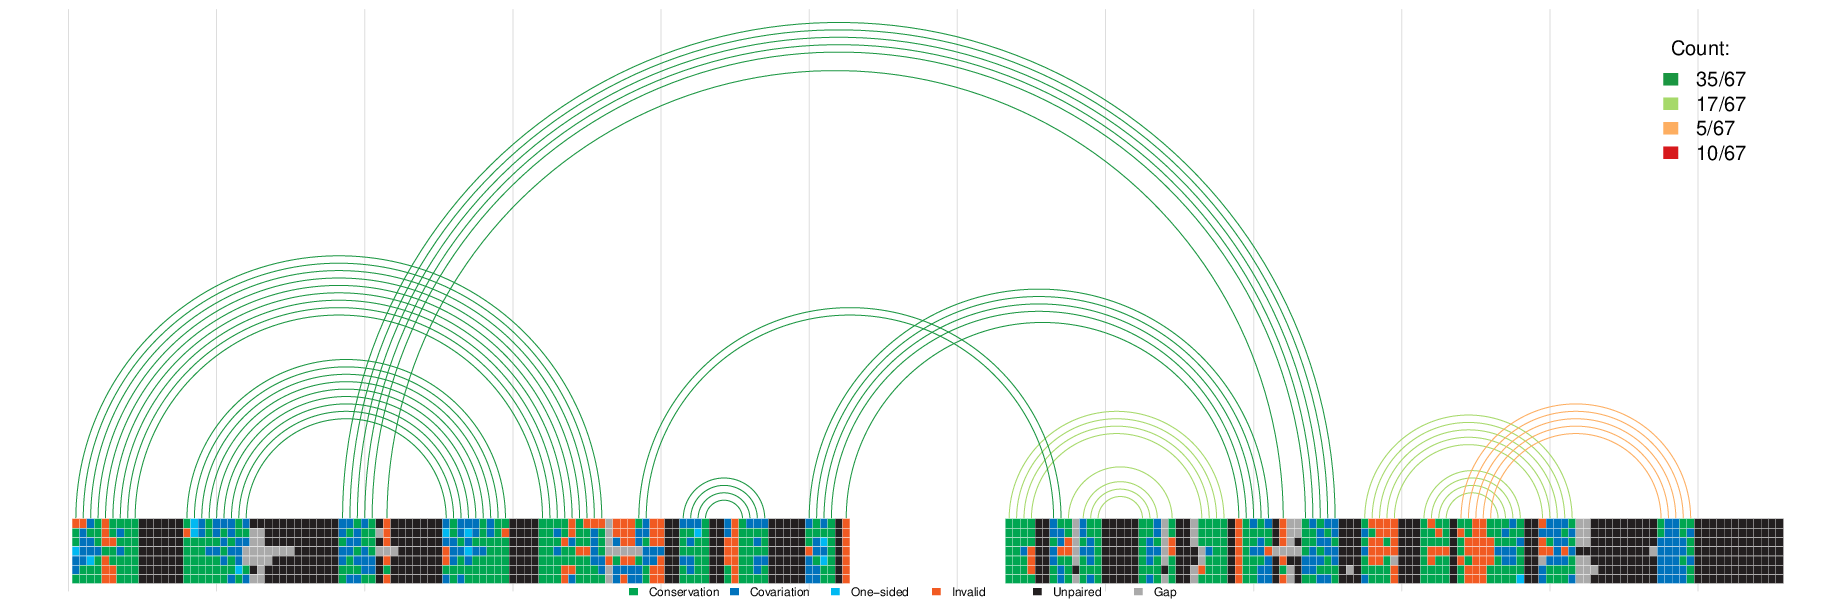
Display multiple sequence alignments with structure, colouring alignment nucleotides by basepair status.
e.g. Rfam Basepairs for RF00458 coloured by covariation, over alignment of seven homologues coloured by basepairing status.
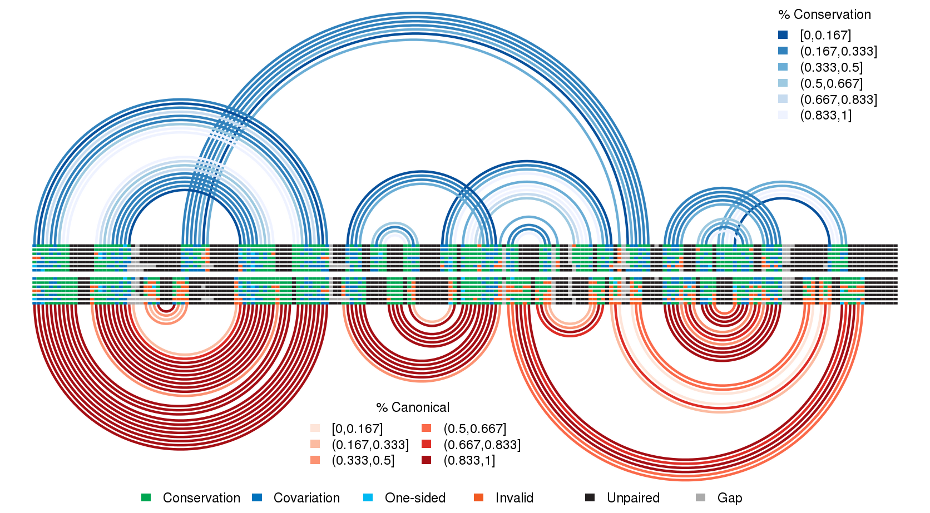
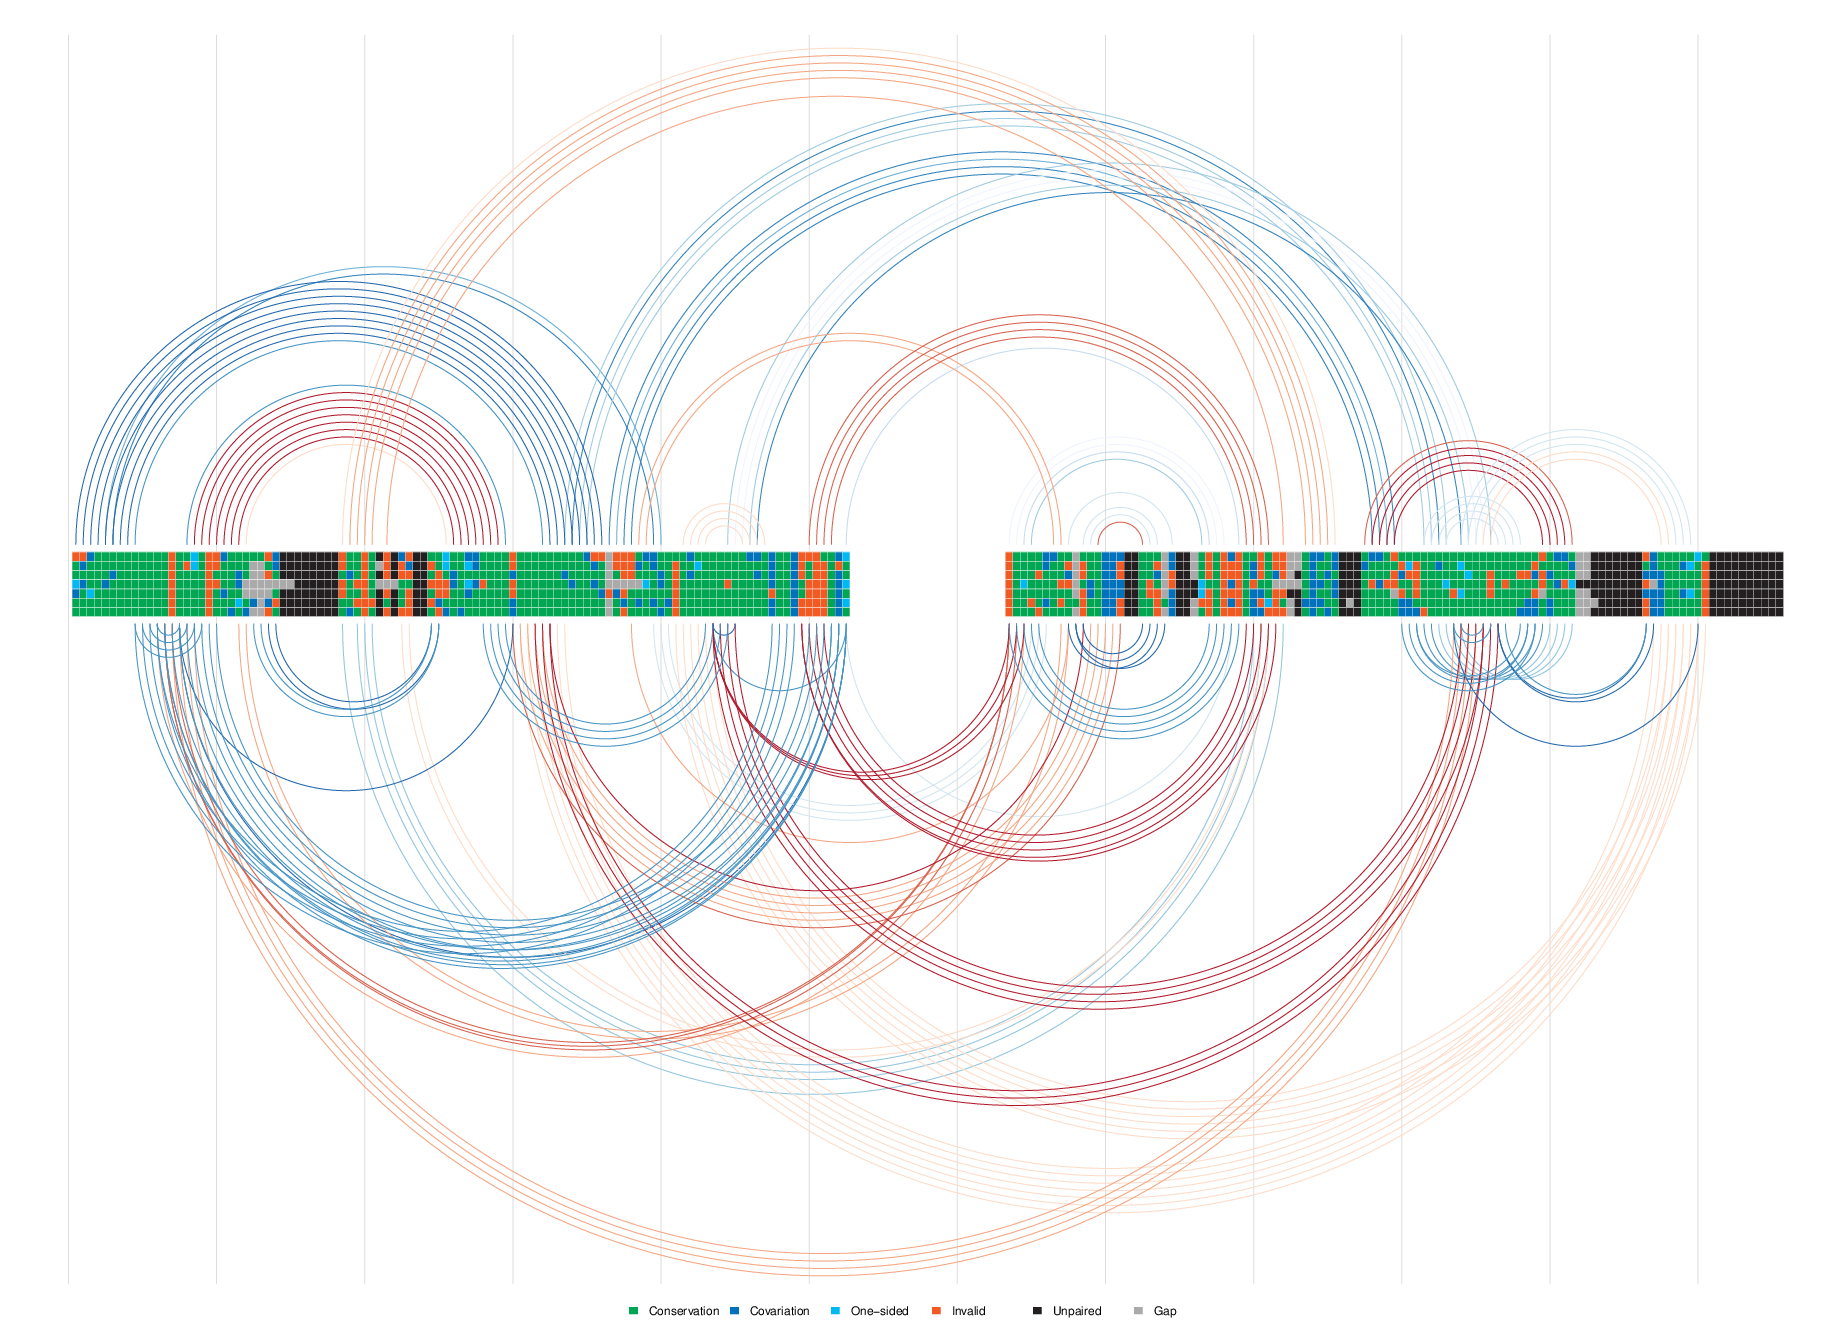
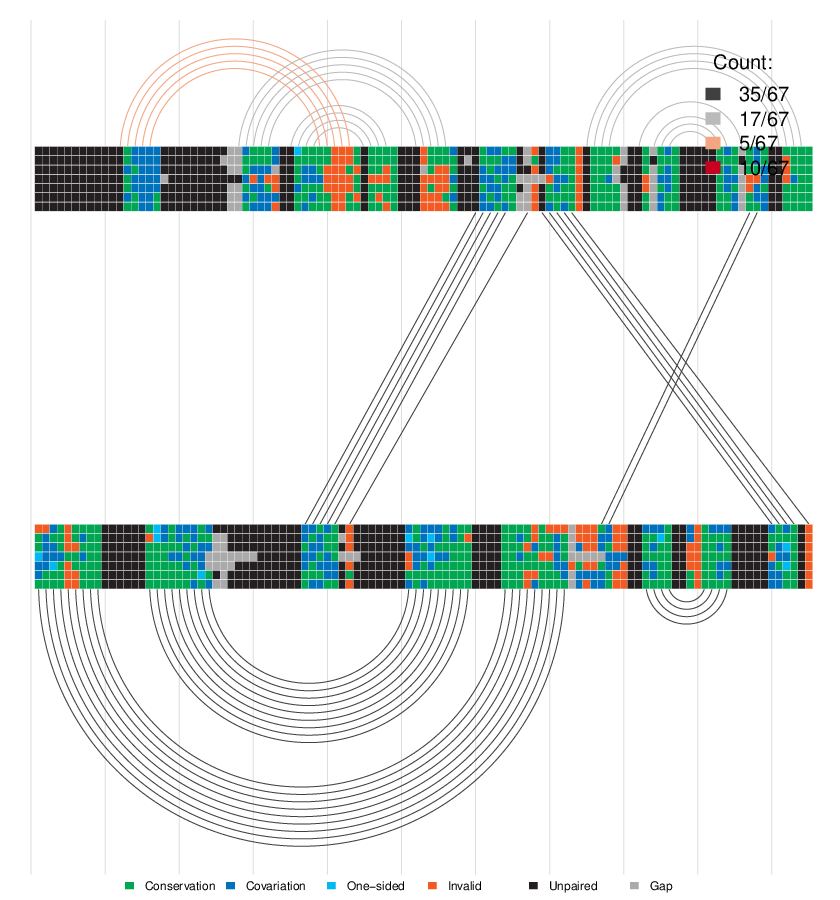
Display multiple sequence alignments for two structures for easy comparison of structures and/or alignments.
Top: Rfam structure for Cripavirus IRES, RF00458, coloured by conservation, on top of an alignment of homologues.
Bottom: Predicted structure of RF00458 coloured by percent canonical basepairs, below the same alignment
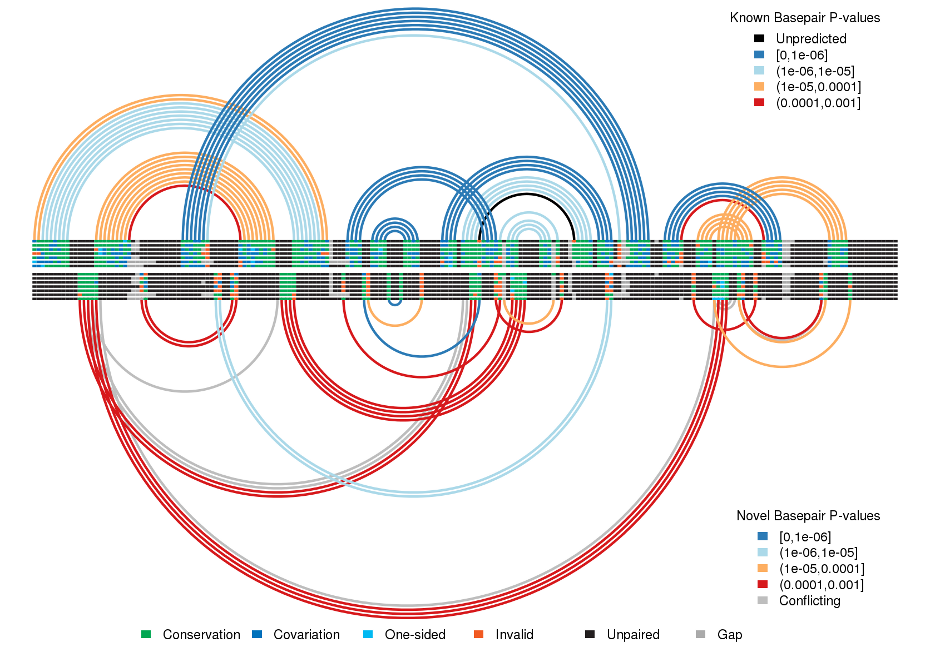
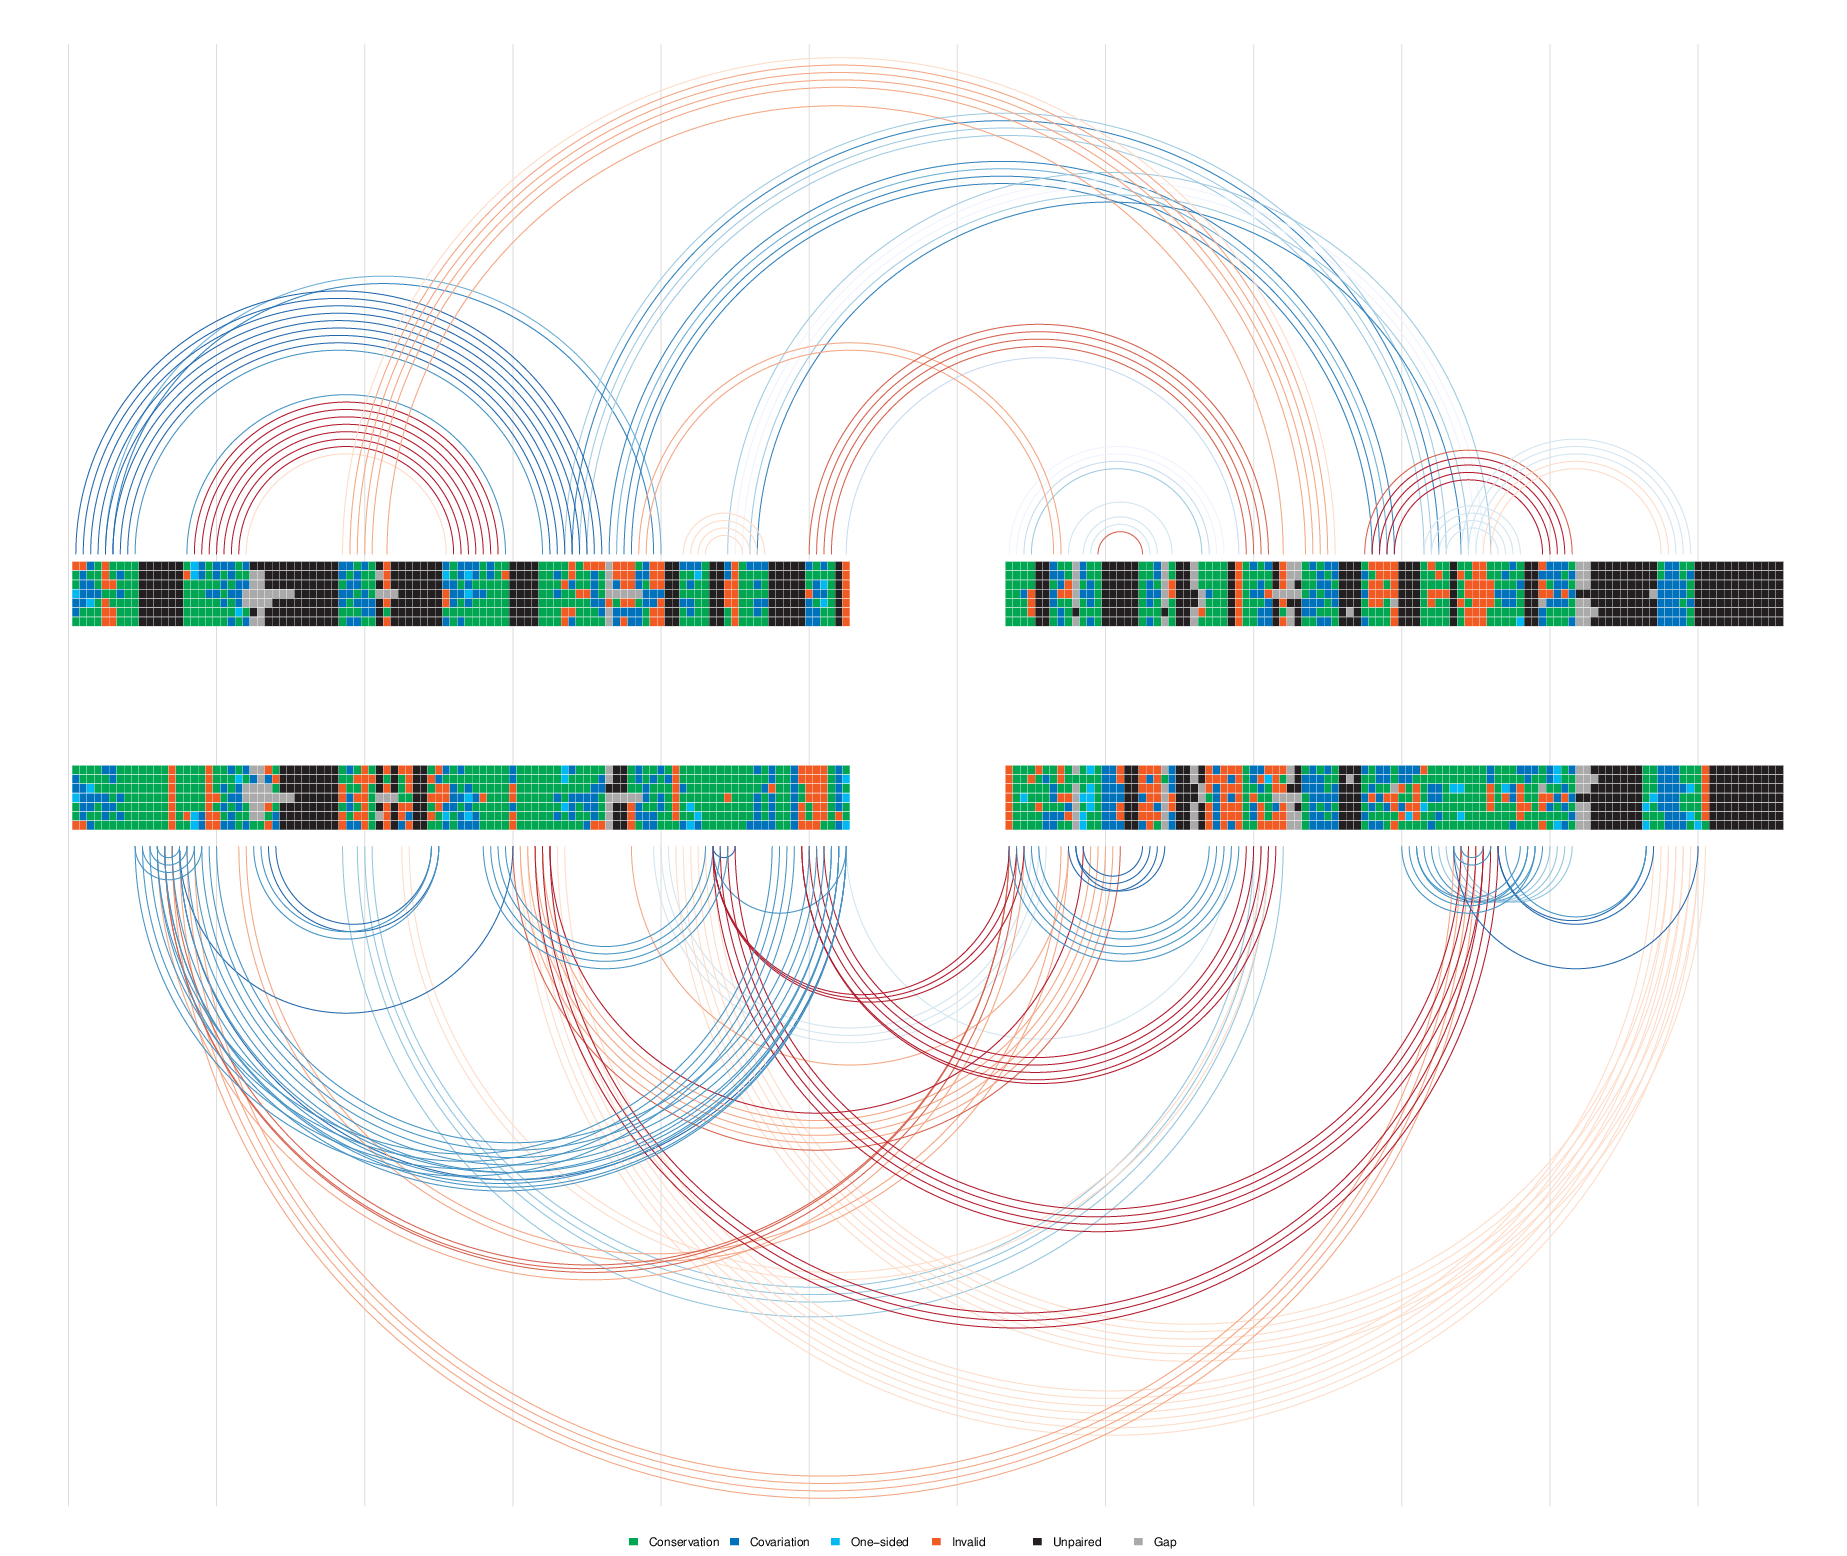
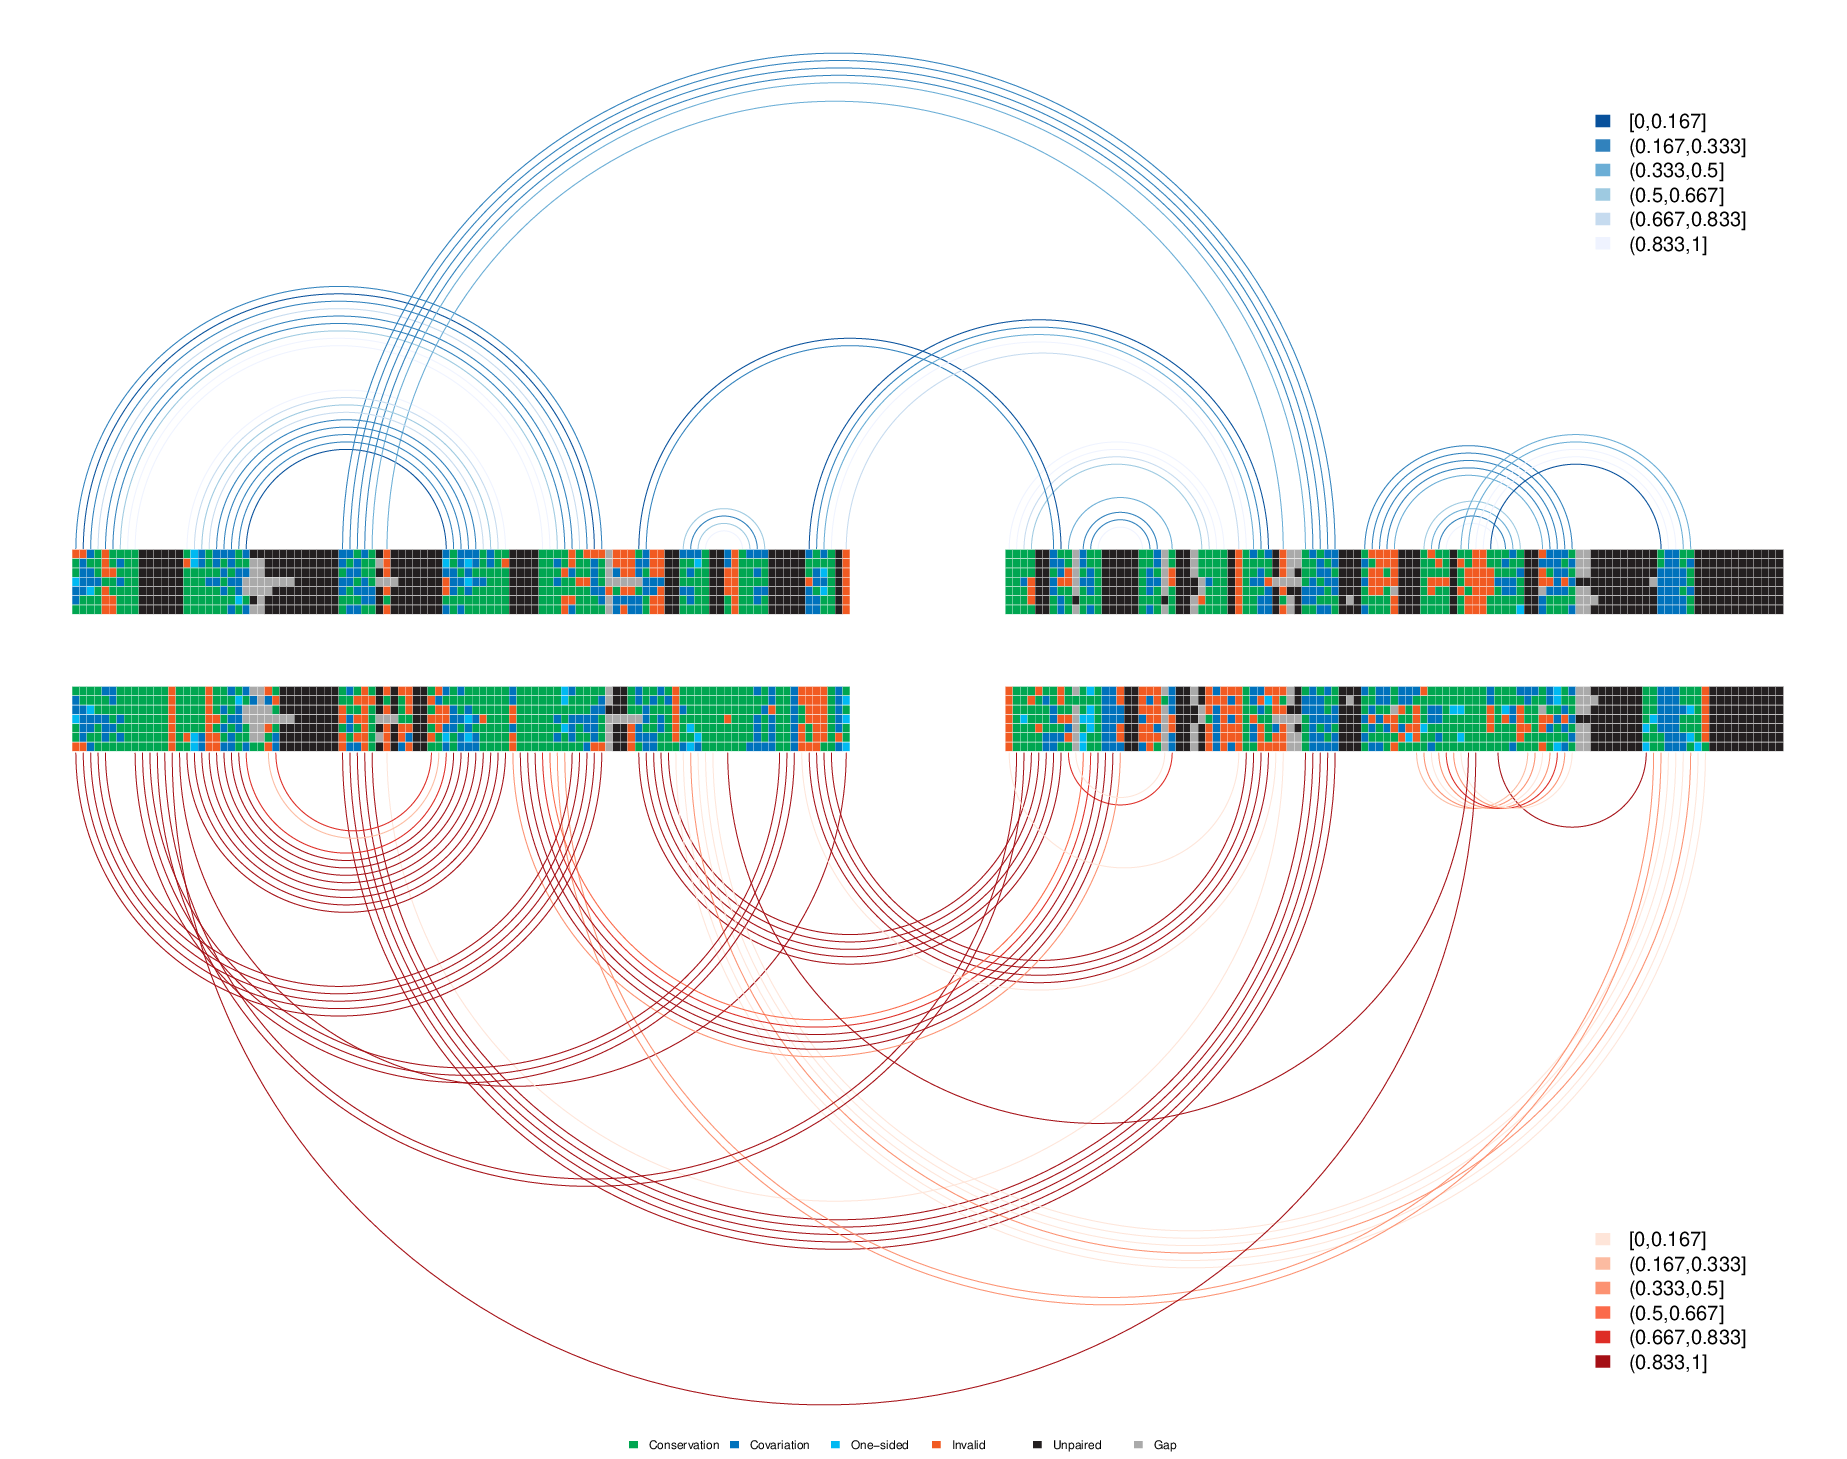
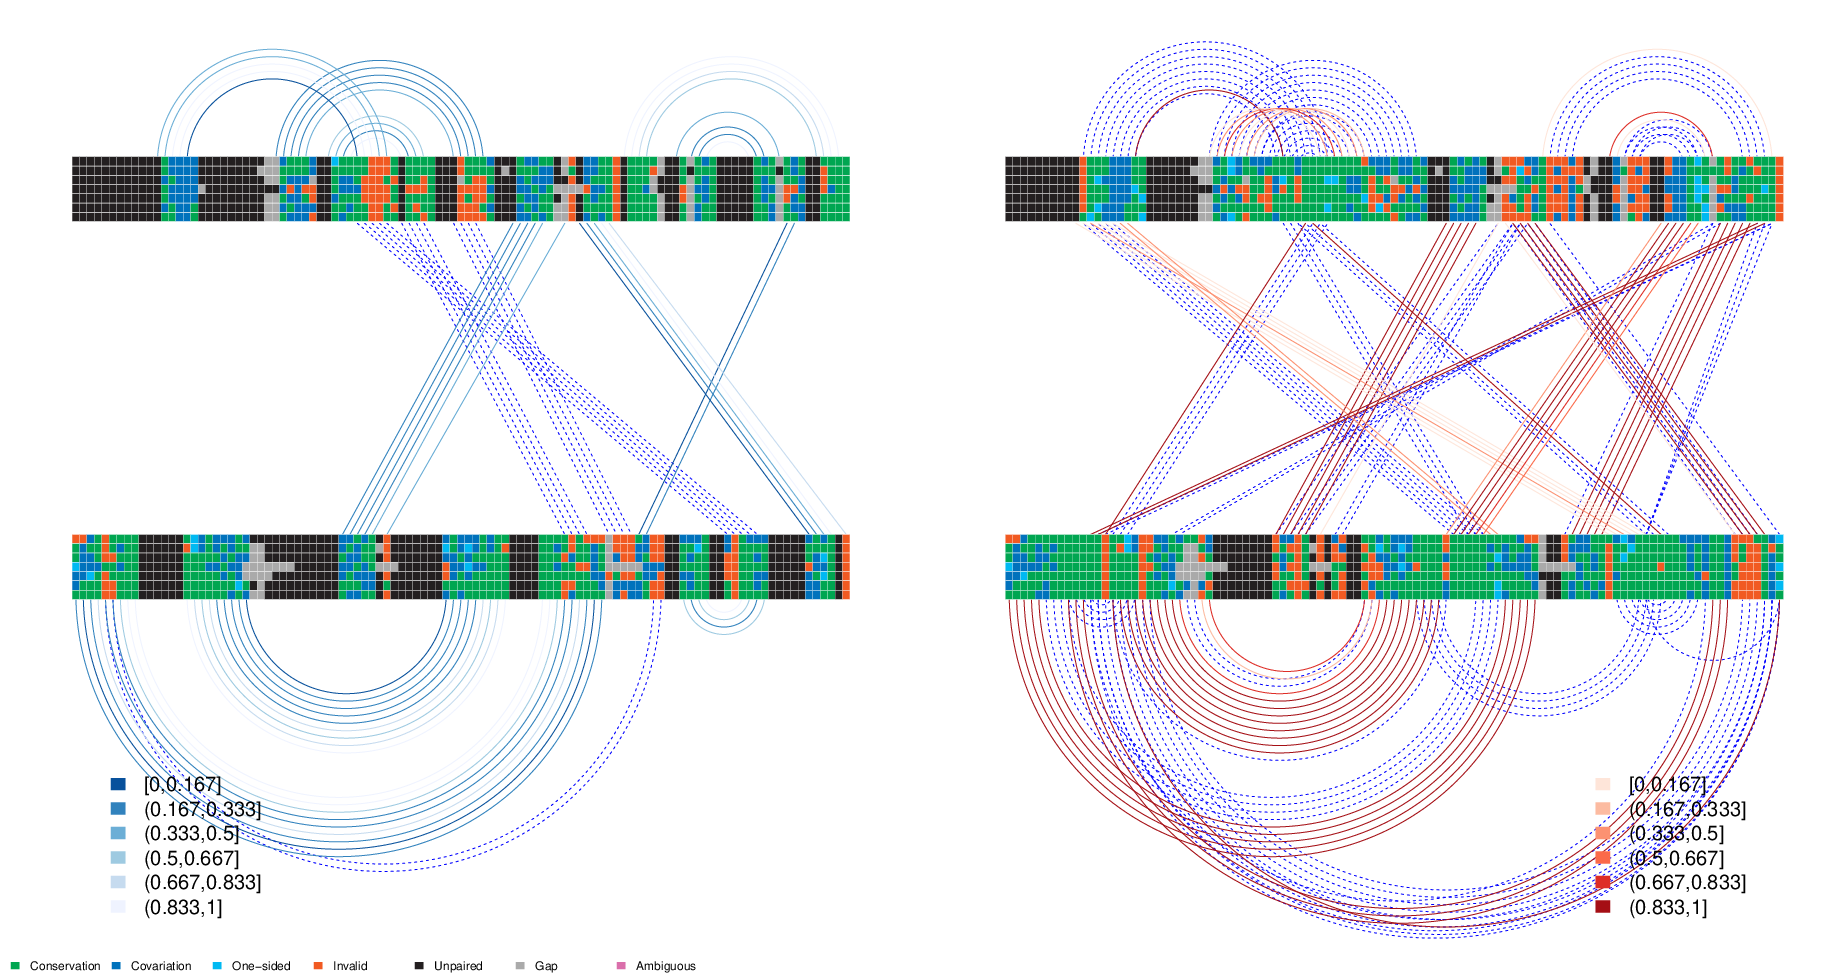
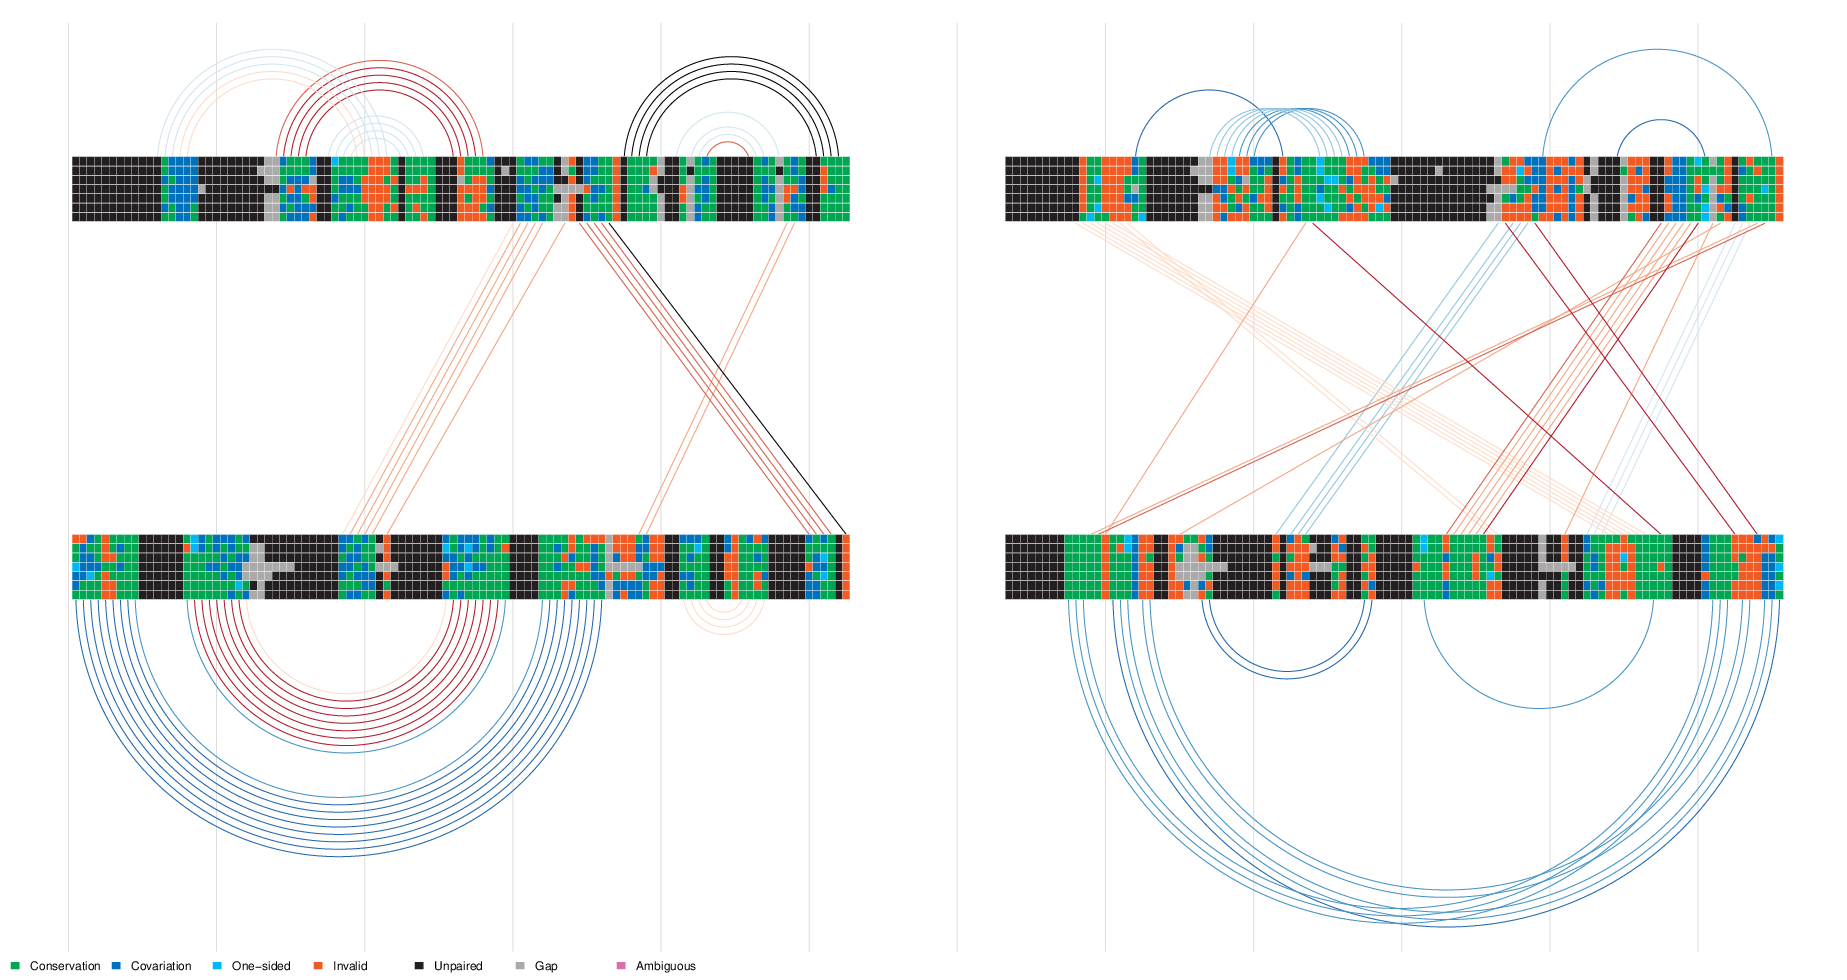
Highlight similarities and differences of two structures using basepair information for known and novel basepairs on alignments.
Top: Known RF00458 helices, shown in colour when predicted by TRANSAT, with covariance of predicted helices.
Bottom: Novel helices predicted by TRANSAT in RF00458, coloured by scored, showing covariation.
License
Web servers are available for everyone to use.
All tools are available to everyone under a CC BY-NC-ND licence. This means that users are only allowed to share (copy, distribute) for non-commercial purposes, but are not allowed to distribute adapted versions. Click to find out more about the licence.